Prometheus搭建简单的监控告警系统

说明

使用的操作系统为CentOS 7.6.1810,其他系统请自己根据差异做对应调整

仅用于记录部署过程

告警通知对接了邮件和钉钉机器人

安装

在监控告警系统主机上安装prometheus、alertmanager和grafana

被监控的主机安装各种各样的exporter,每个exporter只监控自身的服务状态

环境准备

1
2
3
4
5
6
# 创建prometheus配置目录
mkdir -p /etc/prometheus /etc/prometheus/rules.d
# 创建prometheus用户
useradd prometheus
# 修改属主属组
chown -R prometheus:prometheus /etc/prometheus

软件包

prometheus

prometheus-v2.9.2

1
2
3
4
5
6
7
8
9
10
11
12
# 下载解压
wget -O - https://github.com/prometheus/prometheus/releases/download/v2.9.2/prometheus-2.9.2.linux-amd64.tar.gz | tar xz

# 创建数据目录
mkdir -p /var/lib/prometheus
chwon -R prometheus:prometheus /var/lib/prometheus

# 拷贝文件到对应位置
cd prometheus-2.9.2.linux-amd64
chown -R prometheus:prometheus prometheus promtool console_libraries consoles prometheus.yml
mv prometheus promtool /usr/local/bin/
mv console_libraries consoles prometheus.yml /etc/prometheus/

alertmanager

alertmanager-v0.17.0

1
2
3
4
5
6
7
8
9
10
11
12
# 下载解压
wget -O - https://github.com/prometheus/alertmanager/releases/download/v0.17.0/alertmanager-0.17.0.linux-amd64.tar.gz | tar xz

# 创建数据目录
mkdir -p /var/lib/prometheus
chwon -R prometheus:prometheus /var/lib/prometheus

# 拷贝文件
cd alertmanager-0.17.0.linux-amd64
chown -R prometheus:prometheus alertmanager alertmanager.yml amtool
mv alertmanager amtool /usr/local/bin/
mv alertmanager.yml /etc/prometheus

node_exporter

node_exporter-v0.18.0

1
2
3
4
5
6
# 下载解压
wget -O - https://github.com/prometheus/node_exporter/releases/download/v0.18.0/node_exporter-0.18.0.linux-amd64.tar.gz | tar xz
cd node_exporter-0.18.0.linux-amd64
chown prometheus:prometheus node_exporter
# 拷贝文件
mv node_exporter /usr/local/bin/

mysqld_exporter

mysqld_exporter-v0.11.0

1
2
3
4
5
6
# 下载解压
wget -O - https://github.com/prometheus/mysqld_exporter/releases/download/v0.11.0/mysqld_exporter-0.11.0.linux-amd64.tar.gz | tar xz
cd mysqld_exporter-0.11.0.linux-amd64
chown prometheus:prometheus mysqld_exporter
# 拷贝文件
mv mysqld_exporter /usr/local/bin/

postgresql_exporter

1
2
3
4
5
6
# 下载解压
wget -O - https://github.com/wrouesnel/postgres_exporter/releases/download/v0.4.7/postgres_exporter_v0.4.7_linux-amd64.tar.gz | tar xz
cd postgres_exporter_v0.4.7_linux-amd64
chown prometheus:prometheus postgres_exporter
# 拷贝文件
mv postgres_exporter /usr/local/bin/

blackbox_exporter

blackbox_exporter-v0.14.0

1
2
3
4
5
6
7
# 下载解压
wget -O - https://github.com/prometheus/blackbox_exporter/releases/download/v0.14.0/blackbox_exporter-0.14.0.linux-amd64.tar.gz | tar xz
cd blackbox_exporter-0.14.0.linux-amd64
chown prometheus:prometheus blackbox_exporter blackbox.yml
# 拷贝文件
mv blackbox_exporter /usr/local/bin/
mv blackbox.yml /etc/prometheus/

grafana

grafana-v6.1.6

1
2
3
# 下载
wget https://dl.grafana.com/oss/release/grafana-6.1.6-1.x86_64.rpm
yum localinstall grafana-6.1.6-1.x86_64.rpm

配置

Prometheus

/etc/prometheus/prometheus.yml

1
2
3
4
5
6
7
8
9
10
11
12
13
14
15
16
17
18
19
20
21
22
23
24
25
26
27
28
29
30
31
32
33
34
35
36
37
38
39
40
41
42
43
44
45
46
47
48
49
50
global:
scrape_interval: 15s
scrape_timeout: 10s
evaluation_interval: 15s
alerting:
alertmanagers:
- static_configs:
- targets:
- localhost:9093
scheme: http
timeout: 10s
rule_files:
- /etc/prometheus/rules.d/*.rules
scrape_configs:
- job_name: prometheus
honor_timestamps: true
scrape_interval: 5s
scrape_timeout: 5s
metrics_path: /metrics
scheme: http
static_configs:
- targets:
- localhost:9090
- job_name: node-exporter
honor_timestamps: true
scrape_interval: 5s
scrape_timeout: 5s
metrics_path: /metrics
scheme: http
static_configs:
- targets:
- localhost:9100
- job_name: mysqld-exporter
honor_timestamps: true
scrape_interval: 5s
scrape_timeout: 5s
metrics_path: /metrics
scheme: http
static_configs:
- targets:
- localhost:9104
- job_name: postgresql-exporter
honor_timestamps: true
scrape_interval: 5s
scrape_timeout: 5s
metrics_path: /metrics
scheme: http
static_configs:
- targets:
- localhost:9187

/etc/prometheus/rules.d/host-status.rules

1
2
3
4
5
6
7
8
9
10
11
12
13
14
15
16
17
18
19
20
21
22
23
24
25
26
27
28
29
30
31
32
33
34
35
36
37
38
39
40
41
42
43
groups:
- name: host-status-rule
rules:
- alert: NodeFilesystemSpaceUsage
expr: ( 1 - (node_filesystem_avail_bytes{fstype=~"ext[234]|btrfs|xfs|zfs"} / node_filesystem_size_bytes{fstype=~"ext[234]|btrfs|xfs|zfs"}) ) * 100 > 85
for: 1m
labels:
team: node
annotations:
summary: "{{$labels.instance}}: 文件系统空间使用率过高"
description: "{{$labels.instance}}: 文件系统空间使用率超过 85% (当前使用率: {{ $value }})"
- alert: NodeFilesystemInodeUsage
expr: ( 1 - (node_filesystem_files_free{fstype=~"ext[234]|btrfs|xfs|zfs"} / node_filesystem_files{fstype=~"ext[234]|btrfs|xfs|zfs"}) ) * 100 > 80
for: 1m
labels:
team: node
annotations:
summary: "{{$labels.instance}}: 文件系统inode使用率过高"
description: "{{$labels.instance}}: 文件系统inode使用率超过 80% (当前使用率: {{ $value }})"
- alert: NodeFilesystemReadOnly
expr: node_filesystem_readonly{job="node-exporter",device!~'rootfs'} == 1
for: 1m
labels:
team: node
annotations:
summary: "{{$labels.instance}}: 文件系统只读状态"
description: "{{$labels.instance}}: 文件系统只读状态"
- alert: NodeMemoryUsage
expr: (node_memory_MemTotal - (node_memory_MemFree+node_memory_Buffers+node_memory_Cached )) / node_memory_MemTotal * 100 > 80
for: 1m
labels:
team: node
annotations:
summary: "{{$labels.instance}}: 内存使用率过高"
description: "{{$labels.instance}}: 内存使用率过高超过80% (当前使用率: {{ $value }})"
- alert: NodeCPUUsage
expr: (100 - (avg by (instance) (irate(node_cpu_seconds_total{mode='idle',job="node-exporter"}[1m])) * 100)) > 80
for: 1m
labels:
team: node
annotations:
summary: "{{$labels.instance}}: CPU使用率过高"
description: "{{$labels.instance}}: CPU使用率超过80% (当前使用率: {{ $value }})"

/etc/prometheus/rules.d/mysql-status.rules

1
2
3
4
5
6
7
8
9
10
11
12
13
14
15
16
17
18
19
20
21
22
23
24
25
26
27
28
29
30
31
32
33
34
35
36
37
38
39
40
41
42
43
44
45
46
47
48
49
50
51
52
53
54
55
56
57
58
59
60
61
62
63
64
65
66
67
68
69
70
71
72
73
74
75
76
77
78
79
80
81
82
83
84
85
86
87
88
89
90
91
92
93
94
95
96
97
98
99
100
101
102
103
104
105
106
107
108
109
110
111
112
113
114
115
116
117
118
119
120
121
122
123
124
125
126
127
128
129
130
131
groups:
- name: MySQLStatsAlert
rules:
- alert: MySQL is down
expr: mysql_up == 0
for: 1m
labels:
severity: critical
annotations:
summary: "Instance {{ $labels.instance }} MySQL is down"
description: "MySQL database is down. This requires immediate action!"
- alert: open files high
expr: mysql_global_status_innodb_num_open_files > (mysql_global_variables_open_files_limit) * 0.75
for: 1m
labels:
severity: warning
annotations:
summary: "Instance {{ $labels.instance }} open files high"
description: "Open files is high. Please consider increasing open_files_limit."
- alert: Read buffer size is bigger than max. allowed packet size
expr: mysql_global_variables_read_buffer_size > mysql_global_variables_slave_max_allowed_packet
for: 1m
labels:
severity: warning
annotations:
summary: "Instance {{ $labels.instance }} Read buffer size is bigger than max. allowed packet size"
description: "Read buffer size (read_buffer_size) is bigger than max. allowed packet size (max_allowed_packet).This can break your replication."
- alert: Sort buffer possibly missconfigured
expr: mysql_global_variables_innodb_sort_buffer_size <256*1024 or mysql_global_variables_read_buffer_size > 4*1024*1024
for: 1m
labels:
severity: warning
annotations:
summary: "Instance {{ $labels.instance }} Sort buffer possibly missconfigured"
description: "Sort buffer size is either too big or too small. A good value for sort_buffer_size is between 256k and 4M."
- alert: Thread stack size is too small
expr: mysql_global_variables_thread_stack <196608
for: 1m
labels:
severity: warning
annotations:
summary: "Instance {{ $labels.instance }} Thread stack size is too small"
description: "Thread stack size is too small. This can cause problems when you use Stored Language constructs for example. A typical is 256k for thread_stack_size."
- alert: Used more than 80% of max connections limited
expr: mysql_global_status_max_used_connections > mysql_global_variables_max_connections * 0.8
for: 1m
labels:
severity: warning
annotations:
summary: "Instance {{ $labels.instance }} Used more than 80% of max connections limited"
description: "Used more than 80% of max connections limited"
- alert: InnoDB Force Recovery is enabled
expr: mysql_global_variables_innodb_force_recovery != 0
for: 1m
labels:
severity: warning
annotations:
summary: "Instance {{ $labels.instance }} InnoDB Force Recovery is enabled"
description: "InnoDB Force Recovery is enabled. This mode should be used for data recovery purposes only. It prohibits writing to the data."
- alert: InnoDB Log File size is too small
expr: mysql_global_variables_innodb_log_file_size < 16777216
for: 1m
labels:
severity: warning
annotations:
summary: "Instance {{ $labels.instance }} InnoDB Log File size is too small"
description: "The InnoDB Log File size is possibly too small. Choosing a small InnoDB Log File size can have significant performance impacts."
- alert: InnoDB Flush Log at Transaction Commit
expr: mysql_global_variables_innodb_flush_log_at_trx_commit != 1
for: 1m
labels:
severity: warning
annotations:
summary: "Instance {{ $labels.instance }} InnoDB Flush Log at Transaction Commit"
description: "InnoDB Flush Log at Transaction Commit is set to a values != 1. This can lead to a loss of commited transactions in case of a power failure."
- alert: Table definition cache too small
expr: mysql_global_status_open_table_definitions > mysql_global_variables_table_definition_cache
for: 1m
labels:
severity: page
annotations:
summary: "Instance {{ $labels.instance }} Table definition cache too small"
description: "Your Table Definition Cache is possibly too small. If it is much too small this can have significant performance impacts!"
- alert: Table open cache too small
expr: mysql_global_status_open_tables >mysql_global_variables_table_open_cache * 99/100
for: 1m
labels:
severity: page
annotations:
summary: "Instance {{ $labels.instance }} Table open cache too small"
description: "Your Table Open Cache is possibly too small (old name Table Cache). If it is much too small this can have significant performance impacts!"
- alert: Thread stack size is possibly too small
expr: mysql_global_variables_thread_stack < 262144
for: 1m
labels:
severity: page
annotations:
summary: "Instance {{ $labels.instance }} Thread stack size is possibly too small"
description: "Thread stack size is possibly too small. This can cause problems when you use Stored Language constructs for example. A typical is 256k for thread_stack_size."
- alert: InnoDB Plugin is enabled
expr: mysql_global_variables_ignore_builtin_innodb == 1
for: 1m
labels:
severity: page
annotations:
summary: "Instance {{ $labels.instance }} InnoDB Plugin is enabled"
description: "InnoDB Plugin is enabled"
- alert: Binary Log is disabled
expr: mysql_global_variables_log_bin != 1
for: 1m
labels:
severity: warning
annotations:
summary: "Instance {{ $labels.instance }} Binary Log is disabled"
description: "Binary Log is disabled. This prohibits you to do Point in Time Recovery (PiTR)."
- alert: Binlog Cache size too small
expr: mysql_global_variables_binlog_cache_size < 1048576
for: 1m
labels:
severity: page
annotations:
summary: "Instance {{ $labels.instance }} Binlog Cache size too small"
description: "Binlog Cache size is possibly to small. A value of 1 Mbyte or higher is OK."
- alert: Binlog Transaction Cache size too small
expr: mysql_global_variables_binlog_cache_size < 1048576
for: 1m
labels:
severity: page
annotations:
summary: "Instance {{ $labels.instance }} Binlog Transaction Cache size too small"
description: "Binlog Transaction Cache size is possibly to small. A value of 1 Mbyte or higher is typically OK."

/etc/prometheus/rules.d/postgresql-status.rules

1
2
3
4
5
6
7
8
9
10
11
12
13
14
15
16
17
18
19
20
21
22
23
24
25
26
27
28
29
30
31
32
33
34
35
36
37
38
39
40
41
42
43
44
45
46
47
48
49
50
51
52
53
54
55
56
57
58
59
60
61
62
63
64
65
66
67
68
69
70
71
72
73
74
75
76
77
78
79
80
81
82
83
84
85
86
87
88
89
90
91
92
93
94
95
96
97
98
99
100
101
102
103
104
105
106
107
108
109
110
111
112
113
114
115
116
117
118
119
120
121
122
123
124
125
126
127
128
129
130
131
132
133
134
135
136
137
138
139
140
141
142
143
144
145
146
147
148
149
150
151
152
153
154
155
156
157
158
159
160
161
162
163
164
165
166
167
168
169
170
171
172
173
174
175
176
177
178
179
180
181
182
183
184
185
186
187
188
189
190
191
192
193
194
195
196
197
198
199
200
201
202
203
204
205
206
207
208
209
210
211
212
213
214
215
216
217
218
219
220
221
222
223
224
225
226
227
228
229
230
231
232
233
234
235
236
237
238
239
240
241
242
243
244
245
246
247
248
249
250
251
252
253
254
255
256
257
258
259
260
261
262
263
264
265
266
267
268
269
270
271
272
273
274
275
276
277
278
279
280
281
282
283
284
285
286
287
288
289
290
291
292
293
294
295
296
297
298
299
300
301
302
303
304
305
306
307
308
309
310
311
312
313
314
315
316
317
318
319
320
321
322
323
324
325
326
327
328
329
330
331
332
333
334
335
336
337
338
339
340
341
342
343
344
345
346
347
348
349
350
351
352
353
354
355
356
357
358
359
360
361
362
363
364
365
366
367
368
369
370
371
372
373
374
375
376
377
378
379
380
381
382
383
384
385
386
387
388
389
390
391
392
393
394
395
396
397
398
399
400
401
402
403
404
405
406
407
408
409
410
411
412
413
414
415
416
417
418
419
420
421
422
423
424
425
426
427
428
429
430
431
432
433
434
435
436
437
438
439
440
441
groups:
- name: PostgreSQL-Status-Alert
rules:

########## EXPORTER RULES ##########
- alert: PGExporterScrapeError
expr: pg_exporter_last_scrape_error > 0
for: 60s
labels:
service: postgresql
severity: critical
severity_num: 300
annotations:
summary: 'Postgres Exporter running on {{ $labels.job }} (instance: {{ $labels.instance }}) is encountering scrape errors processing queries. Error count: ( {{ $value }} )'

- alert: NodeExporterScrapeError
expr: node_textfile_scrape_error > 0
for: 60s
labels:
service: system
severity: critical
severity_num: 300
annotations:
summary: 'Node Exporter running on {{ $labels.job }} (instance: {{ $labels.instance }}) is encountering scrape errors processing custom metrics. Error count: ( {{ $value }} )'


########## POSTGRESQL RULES ##########
- alert: PGIsUp
expr: pg_up < 1
for: 60s
labels:
service: postgresql
severity: critical
severity_num: 300
annotations:
summary: 'postgres_exporter running on {{ $labels.job }} is unable to communicate with the configured database'


# Whether a system switches from primary to replica or vice versa must be configured per named job.
# No way to tell what value a system is supposed to be without a rule expression for that specific system
# 2 to 1 means it changed from primary to replica. 1 to 2 means it changed from replica to primary
# Set this alert for each system that you want to monitor a recovery status change
# Below is an example for a target job called "Replica" and watches for the value to change above 1 which means it's no longer a replica
#
# - alert: PGRecoveryStatusSwitch_Replica
# expr: ccp_is_in_recovery_status{job="Replica"} > 1
# for: 60s
# labels:
# service: postgresql
# severity: critical
# severity_num: 300
# annotations:
# summary: '{{ $labels.job }} has changed from replica to primary'


# Absence alerts must be configured per named job, otherwise there's no way to know which job is down
# Below is an example for a target job called "Prod"
# - alert: PGConnectionAbsent
# expr: absent(ccp_connection_stats_max_connections{job="Prod"})
# for: 10s
# labels:
# service: postgresql
# severity: critical
# severity_num: 300
# annotations:
# description: 'Connection metric is absent from target (Prod). Check that postgres_exporter can connect to PostgreSQL.'


- alert: PGIdleTxn
expr: ccp_connection_stats_max_idle_in_txn_time > 300
for: 60s
labels:
service: postgresql
severity: warning
severity_num: 200
annotations:
description: '{{ $labels.job }} has at least one session idle in transaction for over 5 minutes.'
summary: 'PGSQL Instance idle transactions'

- alert: PGIdleTxn
expr: ccp_connection_stats_max_idle_in_txn_time > 900
for: 60s
labels:
service: postgresql
severity: critical
severity_num: 300
annotations:
description: '{{ $labels.job }} has at least one session idle in transaction for over 15 minutes.'
summary: 'PGSQL Instance idle transactions'

- alert: PGQueryTime
expr: ccp_connection_stats_max_query_time > 43200
for: 60s
labels:
service: postgresql
severity: warning
severity_num: 200
annotations:
description: '{{ $labels.job }} has at least one query running for over 12 hours.'
summary: 'PGSQL Max Query Runtime'

- alert: PGQueryTime
expr: ccp_connection_stats_max_query_time > 86400
for: 60s
labels:
service: postgresql
severity: critical
severity_num: 300
annotations:
description: '{{ $labels.job }} has at least one query running for over 1 day.'
summary: 'PGSQL Max Query Runtime'

- alert: PGConnPerc
expr: 100 * (ccp_connection_stats_total / ccp_connection_stats_max_connections) > 75
for: 60s
labels:
service: postgresql
severity: warning
severity_num: 200
annotations:
description: '{{ $labels.job }} is using 75% or more of available connections ({{ $value }}%)'
summary: 'PGSQL Instance connections'

- alert: PGConnPerc
expr: 100 * (ccp_connection_stats_total / ccp_connection_stats_max_connections) > 90
for: 60s
labels:
service: postgresql
severity: critical
severity_num: 300
annotations:
description: '{{ $labels.job }} is using 90% or more of available connections ({{ $value }}%)'
summary: 'PGSQL Instance connections'

- alert: PGDBSize
expr: ccp_database_size > 1.073741824e+11
for: 60s
labels:
service: postgresql
severity: warning
severity_num: 200
annotations:
description: 'PGSQL Instance {{ $labels.job }} over 100GB in size: {{ $value }} bytes'
summary: 'PGSQL Instance size warning'

- alert: PGDBSize
expr: ccp_database_size > 2.68435456e+11
for: 60s
labels:
service: postgresql
severity: critical
severity_num: 300
annotations:
description: 'PGSQL Instance {{ $labels.job }} over 250GB in size: {{ $value }} bytes'
summary: 'PGSQL Instance size critical'

- alert: PGReplicationByteLag
expr: ccp_replication_status_byte_lag > 5.24288e+07
for: 60s
labels:
service: postgresql
severity: warning
severity_num: 200
annotations:
description: 'PGSQL Instance {{ $labels.job }} has at least one replica lagging over 50MB behind.'
summary: 'PGSQL Instance replica lag warning'

- alert: PGReplicationByteLag
expr: ccp_replication_status_byte_lag > 1.048576e+08
for: 60s
labels:
service: postgresql
severity: critical
severity_num: 300
annotations:
description: 'PGSQL Instance {{ $labels.job }} has at least one replica lagging over 100MB behind.'
summary: 'PGSQL Instance replica lag warning'

- alert: PGReplicationSlotsInactive
expr: ccp_replication_slots_active == 0
for: 60s
labels:
service: postgresql
severity: critical
severity_num: 300
annotations:
description: 'PGSQL Instance {{ $labels.job }} has one or more inactive replication slots'
summary: 'PGSQL Instance inactive replication slot'

- alert: PGXIDWraparound
expr: ccp_transaction_wraparound_percent_towards_wraparound > 50
for: 60s
labels:
service: postgresql
severity: warning
severity_num: 200
annotations:
description: 'PGSQL Instance {{ $labels.job }} is over 50% towards transaction id wraparound.'
summary: 'PGSQL Instance {{ $labels.job }} transaction id wraparound imminent'

- alert: PGXIDWraparound
expr: ccp_transaction_wraparound_percent_towards_wraparound > 75
for: 60s
labels:
service: postgresql
severity: critical
severity_num: 300
annotations:
description: 'PGSQL Instance {{ $labels.job }} is over 75% towards transaction id wraparound.'
summary: 'PGSQL Instance transaction id wraparound imminent'

- alert: PGEmergencyVacuum
expr: ccp_transaction_wraparound_percent_towards_emergency_autovac > 75
for: 60s
labels:
service: postgresql
severity: warning
severity_num: 200
annotations:
description: 'PGSQL Instance {{ $labels.job }} is over 75% towards emergency autovacuum processes beginning'
summary: 'PGSQL Instance emergency vacuum imminent'

- alert: PGEmergencyVacuum
expr: ccp_transaction_wraparound_percent_towards_emergency_autovac > 90
for: 60s
labels:
service: postgresql
severity: critical
severity_num: 300
annotations:
description: 'PGSQL Instance {{ $labels.job }} is over 90% towards emergency autovacuum processes beginning'
summary: 'PGSQL Instance emergency vacuum imminent'

- alert: PGArchiveCommandStatus
expr: ccp_archive_command_status_seconds_since_last_fail > 300
for: 60s
labels:
service: postgresql
severity: critical
severity_num: 300
annotations:
description: 'PGSQL Instance {{ $labels.job }} has a recent failing archive command'
summary: 'Seconds since the last recorded failure of the archive_command'

- alert: PGSequenceExhaustion
expr: ccp_sequence_exhaustion_count > 0
for: 60s
labels:
service: postgresql
severity: critical
severity_num: 300
annotations:
description: 'Count of sequences on instance {{ $labels.job }} at over 75% usage: {{ $value }}. Run following query to see full sequence status: SELECT * FROM monitor.sequence_status() WHERE percent >= 75'


########## SYSTEM RULES ##########
- alert: ExporterDown
expr: avg_over_time(up[5m]) < 0.9
for: 10s
labels:
service: system
severity: critical
severity_num: 300
annotations:
description: 'Metrics exporter service for {{ $labels.job }} running on {{ $labels.instance }} has been down at least 50% of the time for the last 5 minutes. Service may be flapping or down.'
summary: 'Prometheus Exporter Service Down'

- alert: DiskUsagePerc
expr: (100 - 100 * sum(node_filesystem_avail_bytes{device!~"tmpfs|by-uuid",fstype=~"xfs|ext"} / node_filesystem_size_bytes{device!~"tmpfs|by-uuid",fstype=~"xfs|ext"}) BY (job,device)) > 70
for: 2m
labels:
service: system
severity: warning
severity_num: 200
annotations:
description: 'Disk usage on target {{ $labels.job }} at {{ $value }}%'

- alert: DiskUsagePerc
expr: (100 - 100 * sum(node_filesystem_avail_bytes{device!~"tmpfs|by-uuid",fstype=~"xfs|ext"} / node_filesystem_size_bytes{device!~"tmpfs|by-uuid",fstype=~"xfs|ext"}) BY (job,device)) > 85
for: 2m
labels:
service: system
severity: critical
severity_num: 300
annotations:
description: 'Disk usage on target {{ $labels.job }} at {{ $value }}%'

- alert: DiskFillPredict
expr: predict_linear(node_filesystem_free_bytes{device!~"tmpfs|by-uuid",fstype=~"xfs|ext"}[1h], 4 * 3600) < 0
for: 5m
labels:
service: system
severity: warning
severity_num: 200
annotations:
description: '(EXPERIMENTAL) Disk {{ $labels.device }} on target {{ $labels.job }} is predicted to fill in 4 hrs based on current usage'

- alert: SystemLoad5m
expr: node_load5 > 5
for: 10m
labels:
service: system
severity: warning
severity_num: 200
annotations:
description: 'System load for target {{ $labels.job }} is high ({{ $value }})'

- alert: SystemLoad5m
expr: node_load5 > 10
for: 10m
labels:
service: system
severity: critical
severity_num: 300
annotations:
description: 'System load for target {{ $labels.job }} is high ({{ $value }})'

- alert: MemoryAvailable
expr: (100 * (node_memory_Available_bytes) / node_memory_MemTotal_bytes) < 25
for: 1m
labels:
service: system
severity: warning
severity_num: 200
annotations:
description: 'Memory available for target {{ $labels.job }} is at {{ $value }}%'

- alert: MemoryAvailable
expr: (100 * (node_memory_MemAvailable_bytes) / node_memory_MemTotal_bytes) < 10
for: 1m
labels:
service: system
severity: critical
severity_num: 300
annotations:
description: 'Memory available for target {{ $labels.job }} is at {{ $value }}%'

- alert: SwapUsage
expr: (100 - (100 * (node_memory_SwapFree_bytes / node_memory_SwapTotal_bytes))) > 60
for: 1m
labels:
service: system
severity: warning
severity_num: 200
annotations:
description: 'Swap usage for target {{ $labels.job }} is at {{ $value }}%'

- alert: SwapUsage
expr: (100 - (100 * (node_memory_SwapFree_byte / node_memory_SwapTotal_bytes))) > 80
for: 1m
labels:
service: system
severity: critical
severity_num: 300
annotations:
description: 'Swap usage for target {{ $labels.job }} is at {{ $value }}%'


########## PGBACKREST RULES ##########
#
# Uncomment and customize one or more of these rules to monitor your pgbackrest backups.
# Full backups are considered the equivalent of both differentials and incrementals since both are based on the last full
# And differentials are considered incrementals since incrementals will be based off the last diff if one exists
# This avoid false alerts, for example when you don't run diff/incr backups on the days that you run a full
# Stanza should also be set if different intervals are expected for each stanza.
# Otherwise rule will be applied to all stanzas returned on target system if not set.
# Otherwise, all backups returned by the pgbackrest info command run from where the database exists will be checked
#
# Relevant metric names are:
# ccp_backrest_last_full_time_since_completion_seconds
# ccp_backrest_last_incr_time_since_completion_seconds
# ccp_backrest_last_diff_time_since_completion_seconds
#
# - alert: PGBackRestLastCompletedFull_main
# expr: ccp_backrest_last_full_backup_time_since_completion_seconds{stanza="main"} > 604800
# for: 60s
# labels:
# service: postgresql
# severity: critical
# severity_num: 300
# annotations:
# summary: 'Full backup for stanza [main] on system {{ $labels.job }} has not completed in the last week.'
#
# - alert: PGBackRestLastCompletedIncr_main
# expr: ccp_backrest_last_incr_backup_time_since_completion_seconds{stanza="main"} > 86400
# for: 60s
# labels:
# service: postgresql
# severity: critical
# severity_num: 300
# annotations:
# summary: 'Incremental backup for stanza [main] on system {{ $labels.job }} has not completed in the last 24 hours.'
#
#
# Runtime monitoring is handled with a single metric:
#
# ccp_backrest_last_runtime_backup_runtime_seconds
#
# Runtime monitoring should have the "backup_type" label set.
# Otherwise the rule will apply to the last run of all backup types returned (full, diff, incr)
# Stanza should also be set if runtimes per stanza have different expected times
#
# - alert: PGBackRestLastRuntimeFull_main
# expr: ccp_backrest_last_runtime_backup_runtime_seconds{backup_type="full", stanza="main"} > 14400
# for: 60s
# labels:
# service: postgresql
# severity: critical
# severity_num: 300
# annotations:
# summary: 'Expected runtime of full backup for stanza [main] has exceeded 4 hours'
#
# - alert: PGBackRestLastRuntimeDiff_main
# expr: ccp_backrest_last_runtime_backup_runtime_seconds{backup_type="diff", stanza="main"} > 3600
# for: 60s
# labels:
# service: postgresql
# severity: critical
# severity_num: 300
# annotations:
# summary: 'Expected runtime of diff backup for stanza [main] has exceeded 1 hour'
##
#
## If the pgbackrest command fails to run, the metric disappears from the exporter output and the alert never fires.
## An absence alert must be configured explicitly for each target (job) that backups are being monitored.
## Checking for absence of just the full backup type should be sufficient (no need for diff/incr).
## Note that while the backrest check command failing will likely also cause a scrape error alert, the addition of this
## check gives a clearer answer as to what is causing it and that something is wrong with the backups.
#
# - alert: PGBackrestAbsentFull_Prod
# expr: absent(ccp_backrest_last_full_backup_time_since_completion_seconds{job="Prod"})
# for: 10s
# labels:
# service: postgresql
# severity: critical
# severity_num: 300
# annotations:
# description: 'Backup Full status missing for Prod. Check that pgbackrest info command is working on target system.'

Alertmanager

/etc/prometheus/alertmanager.yml

1
2
3
4
5
6
7
8
9
10
11
12
13
14
15
16
17
18
19
20
21
22
23
24
25
26
27
28
29
30
31
32
33
34
35
36
37
38
39
40
41
42
43
44
45
46
47
48
49
50
51
52
53
54
55
56
57
58
global:
resolve_timeout: 5m
http_config: {}
smtp_from: monitor@example.com
smtp_hello: localhost
smtp_smarthost: smtp.example.com:465
smtp_auth_username: monitor@example.com
smtp_auth_password: '这里写密码'
smtp_require_tls: false
pagerduty_url: https://events.pagerduty.com/v2/enqueue
hipchat_api_url: https://api.hipchat.com/
opsgenie_api_url: https://api.opsgenie.com/
wechat_api_url: https://qyapi.weixin.qq.com/cgi-bin/
victorops_api_url: https://alert.victorops.com/integrations/generic/20131114/alert/
route:
# 这里配置默认路由到'default-receiver'
receiver: default-receiver
group_by:
- alertname
- cluster
group_wait: 10s
group_interval: 10s
repeat_interval: 1h
inhibit_rules:
- source_match:
severity: critical
target_match:
severity: warning
equal:
- alertname
- dev
- instance
receivers:
- name: default-receiver
email_configs:
- send_resolved: false
to: monitor@example.com
from: monitor@example.com
hello: localhost
smarthost: smtp.example.com:465
auth_username: monitor@example.com
auth_password: '这里写密码'
headers:
From: monitor@example.com
Subject: '{{ template "email.default.subject" . }}'
To: monitor@example.com
html: '{{ template "email.default.html" . }}'
require_tls: false
# 配置钉钉机器人
webhook_configs:
- send_resolved: false
url: http://localhost:8060/dingtalk/webhook001/send
# 配置钉钉机器人
- name: dingtalk002
webhook_configs:
- send_resolved: false
url: http://localhost:8060/dingtalk/webhook002/send
templates: []

配置dingtalk webhook程序

1
2
3
4
5
6
7
8
9
# 这里偷懒用docker跑钉钉的webhook
docker run -d \
--restart=always \
--name prometheus-webhook-dingtalk \
-p 8060:8060 \
-v /usr/share/zoneinfo/Asia/Shanghai:/etc/localtime:ro \
timonwong/prometheus-webhook-dingtalk \
--ding.profile="webhook001=https://oapi.dingtalk.com/robot/send?access_token=xxxxxxxxxxxx" \
--ding.profile="webhook002=https://oapi.dingtalk.com/robot/send?access_token=yyyyyyyyyyy"

blackbox_exporter

/etc/prometheus/backbox_exporter.yml

1
没空搞,占个位

mysqld_exporter

需要创建用于监控的数据库用户

1
2
3
CREATE USER 'prometheus'@'127.0.0.1' IDENTIFIED BY 'prometheus_password' WITH MAX_USER_CONNECTIONS 3;
GRANT PROCESS, REPLICATION CLIENT, SELECT ON *.* TO 'prometheus'@'127.0.0.1';
flush privileges;

postgresql_exporter

根据需求决定是否使用superuser作为postgresql_exporter的数据库用户

如果要创建专用用户可以参照下面的方式创建用户

1
2
3
4
5
6
7
8
9
10
11
12
13
14
15
16
17
18
19
20
21
22
23
24
25
26
27
28
29
30
31
# 创建postgresql_exporter专用用户
CREATE USER postgres_exporter PASSWORD 'password';
ALTER USER postgres_exporter SET SEARCH_PATH TO postgres_exporter,pg_catalog;
# 创建schema
CREATE SCHEMA postgres_exporter;
# 授权schema
GRANT USAGE ON SCHEMA postgres_exporter TO postgres_exporter;
# 创建函数
CREATE FUNCTION get_pg_stat_activity() RETURNS SETOF pg_stat_activity AS
$$ SELECT * FROM pg_catalog.pg_stat_activity; $$
LANGUAGE sql
VOLATILE
SECURITY DEFINER;
# 创建视图
CREATE VIEW postgres_exporter.pg_stat_activity
AS
SELECT * from get_pg_stat_activity();
# 视图授权
GRANT SELECT ON postgres_exporter.pg_stat_activity TO postgres_exporter;
# 创建函数
CREATE FUNCTION get_pg_stat_replication() RETURNS SETOF pg_stat_replication AS
$$ SELECT * FROM pg_catalog.pg_stat_replication; $$
LANGUAGE sql
VOLATILE
SECURITY DEFINER;
# 创建视图
CREATE VIEW postgres_exporter.pg_stat_replication
AS
SELECT * FROM get_pg_stat_replication();
# 视图授权
GRANT SELECT ON postgres_exporter.pg_stat_replication TO postgres_exporter;

grafana

偷懒警告!

这里定义管理员用户密码,还有secret_key,记得自己改,别瞎抄作业!

生产环境不要用默认密码,不然有你哭的时候

[security]
admin_user = admin
admin_password = admin
secret_key = SW2YcwTIb9zpOOhoPsMm

/etc/grafana/grafana.ini

1
2
3
4
5
6
7
8
9
10
11
12
13
14
15
16
17
18
19
20
21
22
23
24
25
26
27
28
29
30
31
32
33
34
35
36
37
38
39
40
41
42
43
44
45
46
47
48
49
50
51
52
53
54
55
56
57
58
59
60
61
62
63
64
65
66
67
68
69
70
71
72
73
74
75
app_mode = production
[paths]
data = /var/lib/grafana
temp_data_lifetime = 24h
logs = /var/log/grafana
plugins = /var/lib/grafana/plugins
[server]
protocol = http
http_port = 3000
# 这里的domain与下面的root_url匹配
domain = grafana
# root_url定义浏览器怎么访问grafana
# http://IP_ADDRESS:3000或者http://domainname:3000
root_url = http://grafana:3000
enable_gzip = true
[database]
log_queries = true
[remote_cache]
[session]
provider = file
[dataproxy]
[analytics]
reporting_enabled = false
check_for_updates = false
[security]
admin_user = admin
admin_password = admin
secret_key = SW2YcwTIb9zpOOhoPsMm
[snapshots]
[dashboards]
versions_to_keep = 10
[users]
default_theme = dark
[auth]
[auth.anonymous]
enabled = true
org_role = Viewer
[auth.github]
[auth.google]
[auth.generic_oauth]
[auth.grafana_com]
[auth.proxy]
[auth.basic]
[auth.ldap]
[smtp]
[emails]
[log]
mode = console file
level = info
[log.console]
[log.file]
log_rotate = true
daily_rotate = true
max_days = 7
[log.syslog]
[alerting]
enabled = true
execute_alerts = true
[explore]
[metrics]
enabled = true
interval_seconds = 10
[metrics.graphite]
[tracing.jaeger]
[grafana_com]
url = https://grafana.com
[external_image_storage]
[external_image_storage.s3]
[external_image_storage.webdav]
[external_image_storage.gcs]
[external_image_storage.azure_blob]
[external_image_storage.local]
[rendering]
[enterprise]
[panels]

systemd服务

prometheus.service

/usr/lib/systemd/system/prometheus.service

1
2
3
4
5
6
7
8
9
10
11
12
13
14
15
16
17
18
19
[Unit]
Description=prometheus
After=network.target
[Service]
Type=simple
User=prometheus
ExecStart=/usr/local/bin/prometheus \
--config.file=/etc/prometheus/prometheus.yml \
--storage.tsdb.path=/var/lib/prometheus \
--storage.tsdb.retention.time=15d \
--storage.tsdb.retention.size=40GB \
--web.console.templates=/etc/prometheus/consoles \
--web.console.libraries=/etc/prometheus/console_libraries
ExecReload=/bin/kill -HUP $MAINPID
Restart=on-failure
RestartSec=60s

[Install]
WantedBy=multi-user.target

alertmanager.servicce

/usr/lib/systemd/system/alertmanager.service

1
2
3
4
5
6
7
8
9
10
11
12
13
14
[Unit]
Description=alertmanager
After=network.target
[Service]
Type=simple
User=prometheus
ExecStart=/usr/local/bin/alertmanager \
--config.file=/etc/prometheus/alertmanager.yml \
--storage.path=/var/lib/alertmanager \
--data.retention=120h
Restart=on-failure
RestartSec=60s
[Install]
WantedBy=multi-user.target

node_exporter.service

/usr/lib/systemd/system/node_exporter.service

1
2
3
4
5
6
7
8
9
10
11
[Unit]
Description=node_exporter
After=network.target
[Service]
Type=simple
User=prometheus
ExecStart=/usr/local/bin/node_exporter
Restart=on-failure
RestartSec=60s
[Install]
WantedBy=multi-user.target

blackbox_exporter.service

/usr/lib/systemd/system/balckbox_exporter.service

1
2
3
4
5
6
7
8
9
10
11
12
13
14
[Unit]
Description=blackbox_exporter
After=network.target
[Service]
Type=simple
User=prometheus
ExecStart=/usr/local/bin/blackbox_exporter \
--config.file=/etc/prometheus/blackbox.yml \
--web.listen-address=:9115 \
--log.level=info
Restart=on-failure
RestartSec=60s
[Install]
WantedBy=multi-user.target

mysqld_exporter.service

/usr/lib/systemd/system/mysqld_exporter.service

1
2
3
4
5
6
7
8
9
10
11
12
13
14
15
16
17
18
19
20
21
22
[Unit]
Description=mysqld_exporter
After=network.target
[Service]
Type=simple
User=prometheus
Environment='DATA_SOURCE_NAME=prometheus:prometheus_password@tcp(127.0.0.1:3306)'
ExecStart=/usr/local/bin/mysqld_exporter \
--collect.engine_innodb_status \
--collect.info_schema.innodb_metrics \
--collect.info_schema.userstats \
--collect.perf_schema.eventsstatements \
--collect.perf_schema.indexiowaits \
--collect.perf_schema.tableiowaits \
--collect.slave_status \
--log.level=info \
--web.listen-address=:9104 \
--web.telemetry-path=/metrics
Restart=on-failure
RestartSec=60s
[Install]
WantedBy=multi-user.target

postgresql_exporter.service

/usr/lib/systemd/system/postgresql_exporter.service

1
2
3
4
5
6
7
8
9
10
11
12
13
14
15
16
[Unit]
Description=postgresql_exporter
After=network.target
[Service]
Type=simple
User=prometheus
Environment=DATA_SOURCE_NAME=postgresql://postgres_exporter:password@localhost:5432/postgres?sslmode=disable
ExecStart=/usr/local/bin/postgresql_exporter \
--web.listen-address=:9187 \
--web.telemetry-path=/metrics \
--log.level=info \
--log.format=logger:stderr
Restart=on-failure
RestartSec=60s
[Install]
WantedBy=multi-user.target

启动服务

修改了systemd脚本之后需要reload一下

1
systemctl daemon-reload

prometheus

1
systemctl enable --now prometheus.service

alertmanager

1
systemctl enable --now alertmanager.service

node_exporter

1
systemctl enable --now node_exporter.service

grafana

1
systemctl enable --now grafana.service

其他

其他服务同理,择需启动对应的服务即可

验证服务

prometheus

浏览器访问http://prometheus_server_ip:9090

alertmanager

浏览器访问http://prometheus_server_ip:9093

node_exporter

浏览器访问http://prometheus_server_ip:9100

grafana

浏览器访问http://prometheus_server_ip:3000

默认用户密码admin/admin,初次登录需要改密码

配置grafana监控面板

这里很多作业可以抄,这里简单列举几个我用到的面板

抄作业之前,先看看人家的说明!

node_exporter面板

1 Node Exporter 0.16–0.18 for Prometheus 监控展示看板
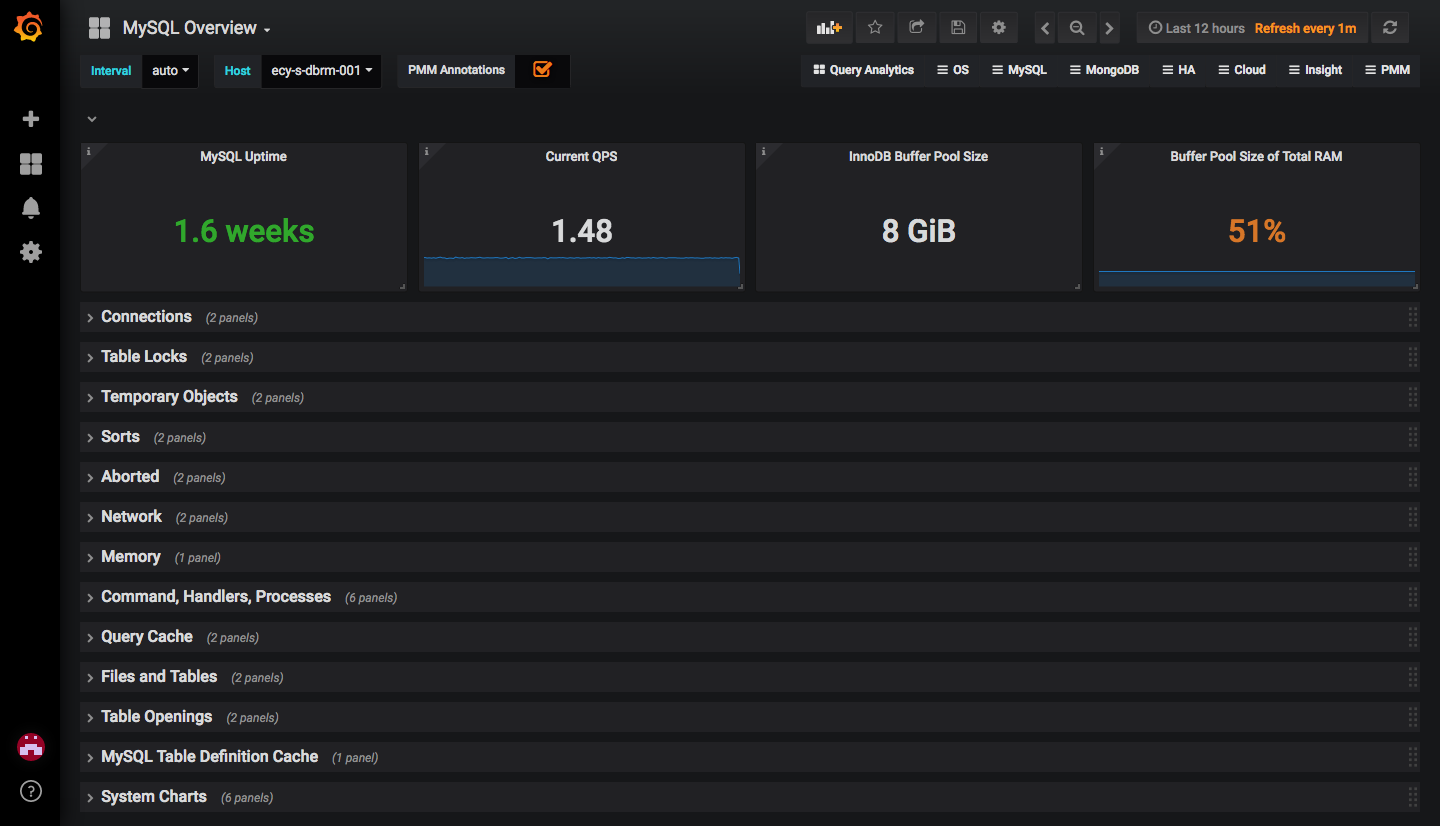
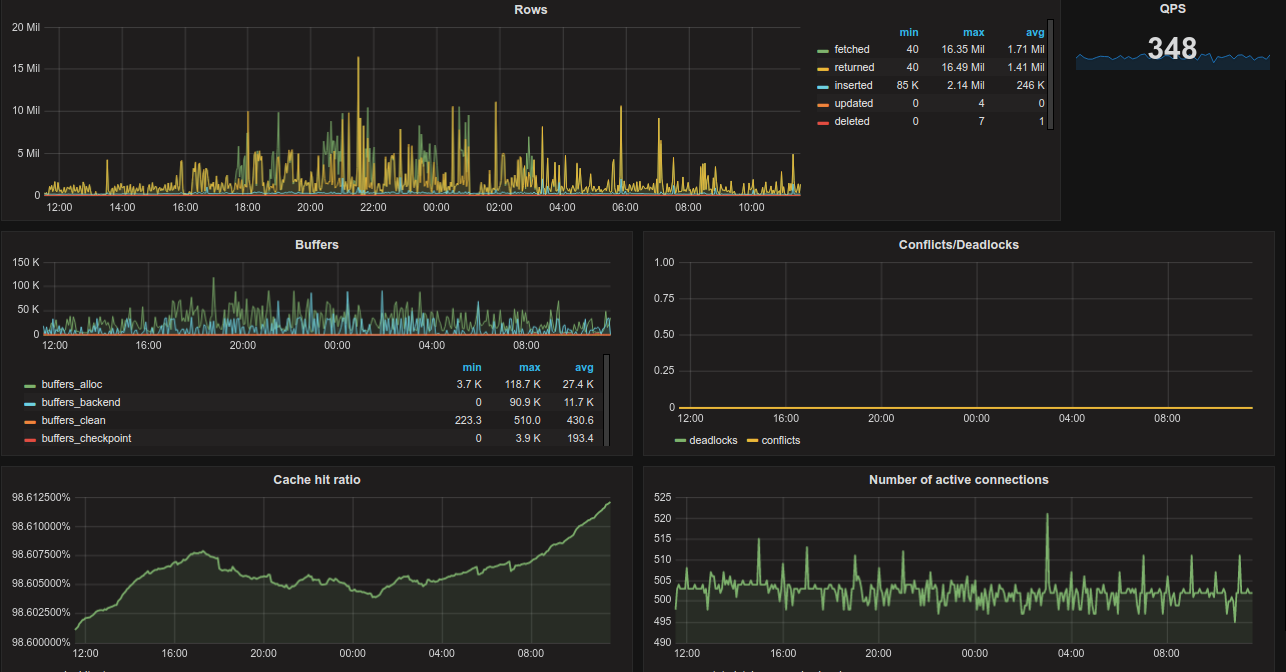
mysqld_exporter面板

Percona出品的dashboard

第三方人员提供的dashboard

postgresql_exporter面板

Postgres Overview

kong面板

kong官方提供的dashboard